This is a concise guide, drawing from my personal journey and insights gained through trading, with a particular emphasis on my experiences in the realm of cryptocurrency trading.
 |
| Ethereum price movement, Binance Data Source: cryptoQuotes |
I started trading in 2019 when one of our family friends was there in my house and we were discussing trading which he was doing at that time. After that, I also started researching about trading. The first time me and my grandpa invested in the IPO of Skyway Group and after a few days, we invested in Solar Group.
 |
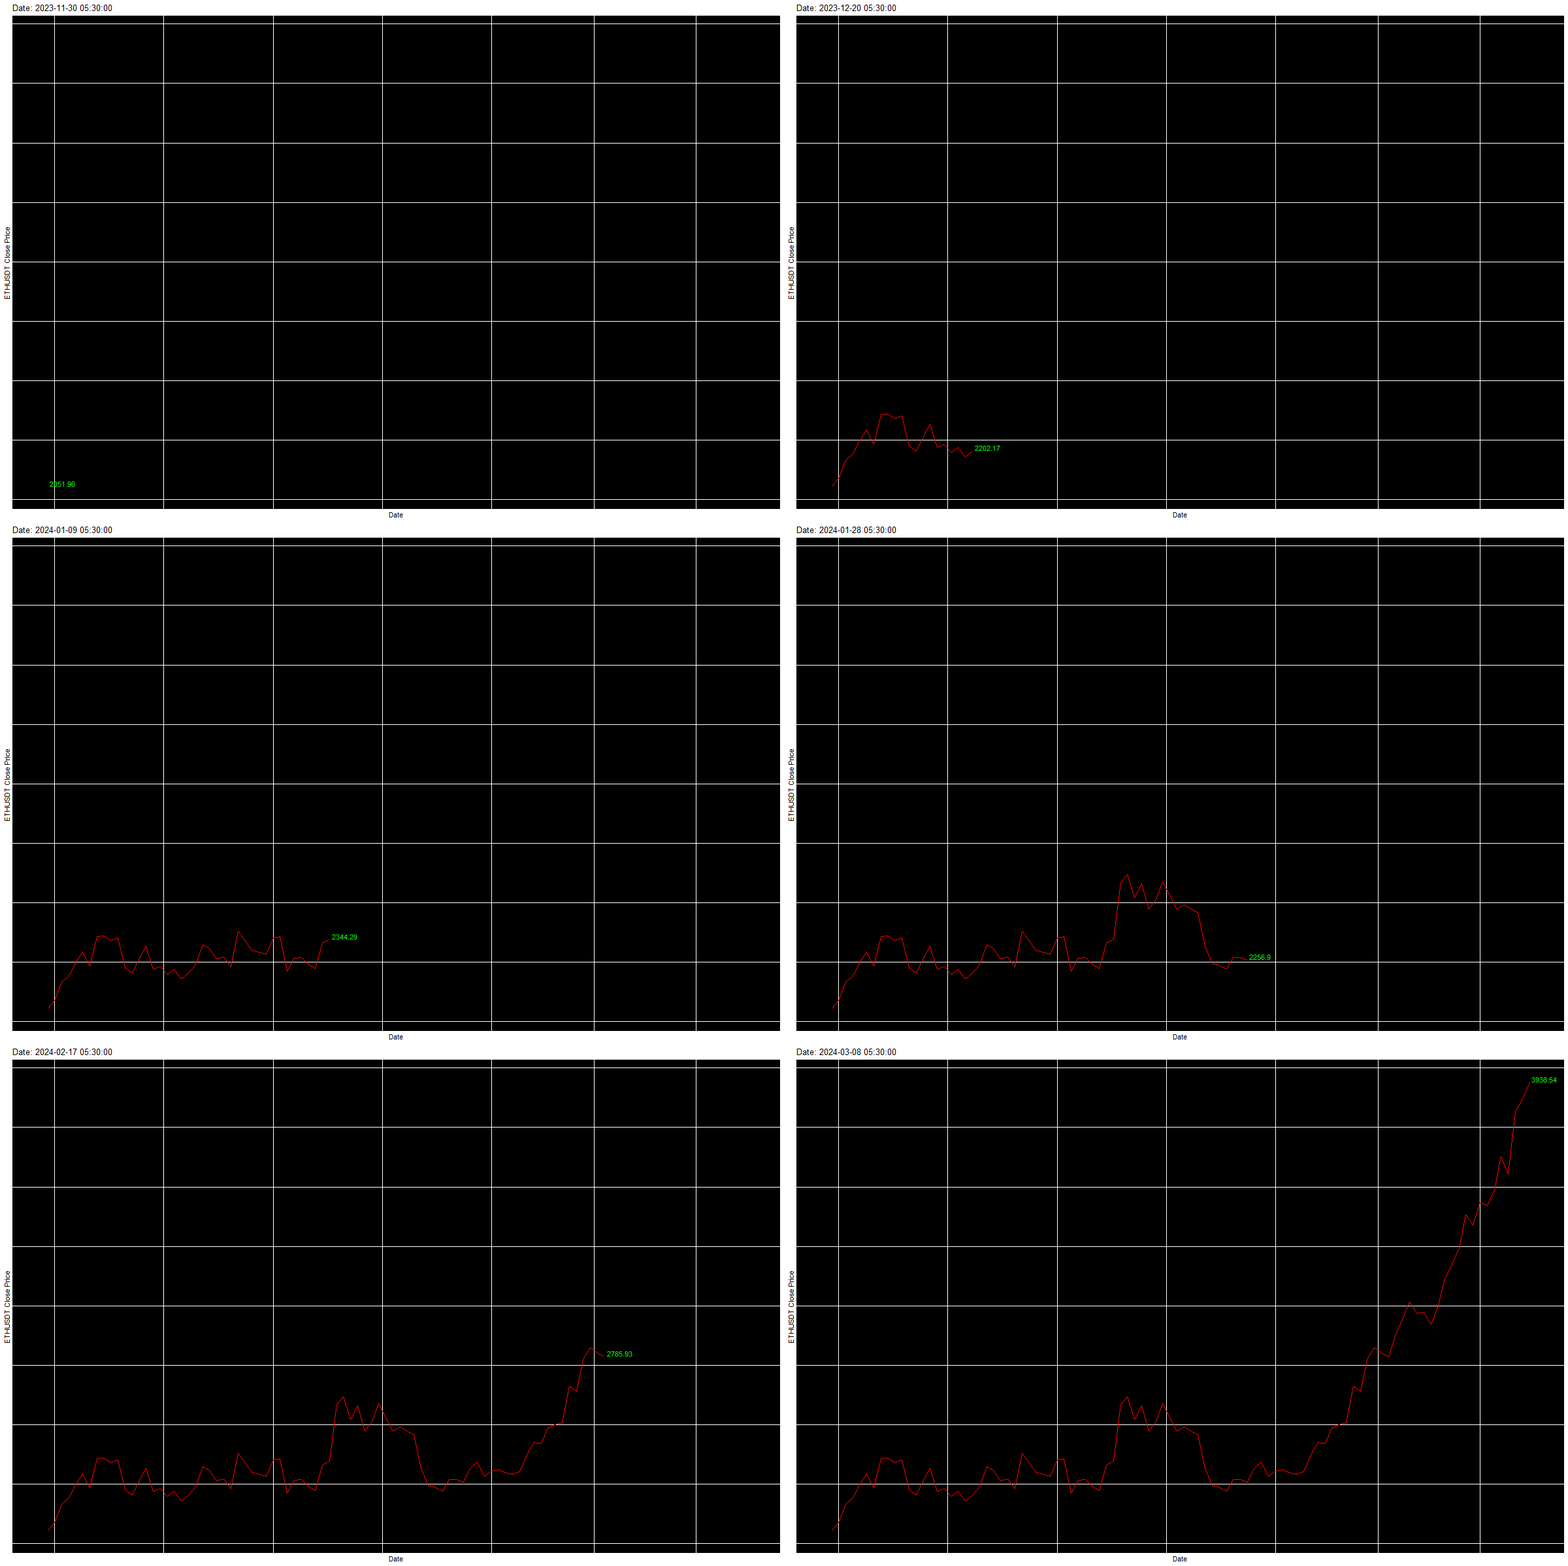
| A view of the market movement of ETHUSDT(Ethereum), Binance using R |
Bollinger Bands: According to John Bollinger, "Bollinger Bands are a technical analysis tool, specifically, they are a type of trading band or envelope. Trading bands and envelopes serve the same purpose, they provide relative definitions of high and low that can be used to create rigorous trading approaches, in pattern recognition, and for much more. Bands are usually thought of as employing a measure of central tendency as a base such as a moving average, whereas envelopes encompass the price structure without a clearly defined central focus, perhaps by reference to highs and lows, or via cyclic analysis. We'll use the term trading bands to refer to any set of curves that market technicians use to define high or low on a relative basis." (1) This band serves as the basis for inferring future market movement.
Policy Awareness: Apart from a good knowledge of market movement government policies play a vital role in trading. If the country’s government takes any action against trading policies, you may face loss too at that time. Financial and policy awareness should be there at the time of investment. I also faced the loss of 40% of my investment at the time when the government announced a ban on cryptocurrency in India.
Greed and Fear: Many times traders panicked and made some bad decisions. Excess greed may also lead to a fall in profit margin. Profit and loss are part of the learning process in trading. One must know how to balance greed and fear when it comes to trading, especially in cryptocurrency.
 |
| Greed and Fear Index of the crypto market with market movement of Bitcoin in Binance. The darker green represents higher greed. |
If someone has better knowledge about trading, he/ she can have the benefit of super profit. One may face loss due to sudden changes in government policies, asymmetric information, etc. But the chances of such events are few. Trading in crypto, stock, or foreign exchange markets is one of the best career choices for students of economics.
(1) A complete explanation of Bollinger Bands
(3) Chapter 7 Quantmod | Techincal Analysis with R (bookdown.org)
ETHUSDT<- cryptoQuotes::getQuote(
ticker = 'ETHUSDT',
source = 'binance',
futures = FALSE,
interval = '1M'
)
quantmod::chartSeries(
x = ETHUSDT,
TA = c(
quantmod::addMACD(),
quantmod::addBBands()
)
)
FGI <- try(
cryptoQuotes::getFGIndex()
)
BTCUSDT <- try(
cryptoQuotes::getQuote(
ticker = 'BTCUSDT',
interval = '1d',
futures = FALSE
)
)
if (!inherits(BTCUSDT, 'try-error') & !inherits(FGI, 'try-error')) {
cryptoQuotes::chart(
chart = cryptoQuotes::kline(
BTCUSDT
) %>% cryptoQuotes::addFGIndex(
FGI = FGI
),
slider = FALSE
)
}
geom_line(color = "red") +
geom_text(aes(label = Close), hjust = -0.1, vjust = -0.1, color = "green") +
labs(x = "Date", y = "ETHUSDT Close Price") +
theme(plot.background = element_rect(fill = "white"),
panel.background = element_rect(fill = "black"))
anim <- p + transition_reveal(Date) +
labs(title = "Date: {frame_along}")
animate(anim, nframes = 100, fps = 8, width = 1200, height = 800)
No comments:
Post a Comment